

The neighbourhoods, compared
All nine neighbourhoods in three tables, then what each one is like to live in.
SEE THE TABLES ↓Each neighbourhood’s own guide: parks, shops, getting around, schools, what we check before you offer, and this month’s numbers.
Nine neighbourhoods share one peninsula, and they behave like nine different markets.
The tables below set them side by side on the figures from the October 2026 report (September 2026 data): the board’s benchmark for each neighbourhood, sales and listings, months of supply, and the days and percent of list price on homes that sold. Then the table that matters as much: what each one is like to live in.
Neighbourhood figures rest on few sales and can move several percent in a month. Read them as a guide to how a neighbourhood behaves, not as a price for a particular home.
Houses, side by side.
| Neighbourhood | Benchmark | Since June | Sold Jul to Sep | For sale | Months of supply | Median days | Sold at % of list |
|---|---|---|---|---|---|---|---|
| Crescent Beach and Ocean Park | $1,528,500 | −4.4% | 34 | 93 | 8.2 | 33 | 95.5% |
| Elgin and Chantrell | $1,981,900 | −11.4% | 23 | 72 | 9.4 | 38 | 94.7% |
| Grandview Heights | $1,716,300 | −1.9% | 26 | 64 | 7.4 | 52 | 95.3% |
| Hazelmere | $2,104,200 | +0.9% | 3 | 7 | too few sales | too few sales | too few sales |
| King George Corridor | $1,315,900 | −1.7% | 25 | 85 | 10.2 | 29 | 96.4% |
| Morgan Creek | $1,926,200 | −1.4% | 11 | 42 | 11.5 | 20 | 97.1% |
| Pacific Douglas | $1,604,100 | −3.3% | 10 | 37 | 11.1 | 20 | 95.7% |
| Sunnyside Park | $1,417,200 | −9.0% | 11 | 45 | 12.3 | 41 | 93.1% |
| White Rock | $1,542,600 | −5.0% | 26 | 133 | 15.3 | 33 | 95.4% |
| The whole peninsula | $1,612,500 | −4.9% | 169 | 578 | 10.3 | 34 | 95.6% |
Benchmarks are the board’s September 2026 index price for each sub-area; the change is since June 2026. For sale is the September figure. Months of supply = homes for sale ÷ (sales July to September ÷ 3). Days and percent of list are the three monthly medians, weighted by sales. Morgan Creek’s index moved +9.1% in September alone on few sales, so it carries no reading. Hazelmere had three sales in three months, too few to read. Houses only; the board’s separate house-with-acreage category is not included.
Townhomes and condos, where there are enough sales.
| Neighbourhood · type | Benchmark | Since June | Sold Jul to Sep | For sale | Months of supply | Median days |
|---|---|---|---|---|---|---|
| Grandview Heights · townhomes | $807,200 | −4.9% | 63 | 123 | 5.9 | 30 |
| King George Corridor · townhomes | $758,000 | −9.1% | 18 | 53 | 8.8 | 23 |
| Morgan Creek · townhomes | $781,200 | −4.8% | 13 | 25 | 5.8 | 18 |
| Sunnyside Park · townhomes | $859,500 | −9.3% | 11 | 18 | 4.9 | 39 |
| The whole peninsula · townhomes | $797,100 | −6.6% | 119 | 279 | 7.0 | 26 |
| White Rock · condos | $543,200 | −2.0% | 66 | 172 | 7.8 | 37 |
| King George Corridor · condos | $568,400 | −3.7% | 50 | 74 | 4.4 | 46 |
| Morgan Creek · condos | $558,900 | −3.9% | 11 | 14 | 3.8 | 27 |
| Sunnyside Park · condos | $496,300 | −4.1% | 14 | 10 | 2.1 | 33 |
| The whole peninsula · condos | $544,400 | −2.9% | 152 | 305 | 6.0 | 37 |
Neighbourhoods with ten or more townhome or condo sales from July to September 2026. The other neighbourhoods had too few attached sales to read on their own.
What each one is like.
| Neighbourhood | What it is like | Catchment secondary, most addresses | Guide |
|---|---|---|---|
| Crescent Beach and Ocean Park | A beach village and a quiet grid of family streets above it | Elgin Park | Read the guide |
| Elgin and Chantrell | Estate country: half-acre and larger grounds, winding lanes | Elgin Park | Read the guide |
| Grandview Heights | The newest streets, walkable shopping and the aquatic centre | Grandview Heights | Read the guide |
| Hazelmere | Country lanes and working acreages in the valley | Earl Marriott or Grandview Heights, by address | Read the guide |
| King George Corridor | The through-route, with some of the peninsula’s most useful value | Earl Marriott or Semiahmoo, by address | Read the guide |
| Morgan Creek | Golf-course streets and executive homes | Elgin Park, Semiahmoo or Grandview Heights, by address | Read the guide |
| Pacific Douglas | Newer family streets near the border | Earl Marriott; some Grandview Heights | Read the guide |
| Sunnyside Park | Parks and trails, every amenity minutes away | Semiahmoo; some Elgin Park or Earl Marriott | Read the guide |
| White Rock | A hillside city above the promenade and the pier | Semiahmoo or Earl Marriott, by address | Read the guide |
Catchments are set by Surrey Schools by address and do not follow neighbourhood boundaries; the district’s school locator is the ruling for any property.
One city, one region, one peninsula.
White Rock is its own city of about 5.1 square kilometres, with its own council and bylaws and the V4B postal prefix. South Surrey is the southern part of the City of Surrey around it. The neighbourhoods above follow the board’s MLS® sub-areas, which do not match school catchments or city maps exactly. White Rock vs South Surrey sets out the differences.
A question about a neighbourhood? Ask it here.
A street, a school catchment, a complex, what a particular home would sell for. Twenty years on the peninsula; a plain answer, usually the same day.
Looking to buy? Tell Hamish the type of home, your budget and your must-haves. He will contact you in the way you prefer when a suitable home comes up.
Where to go from here.
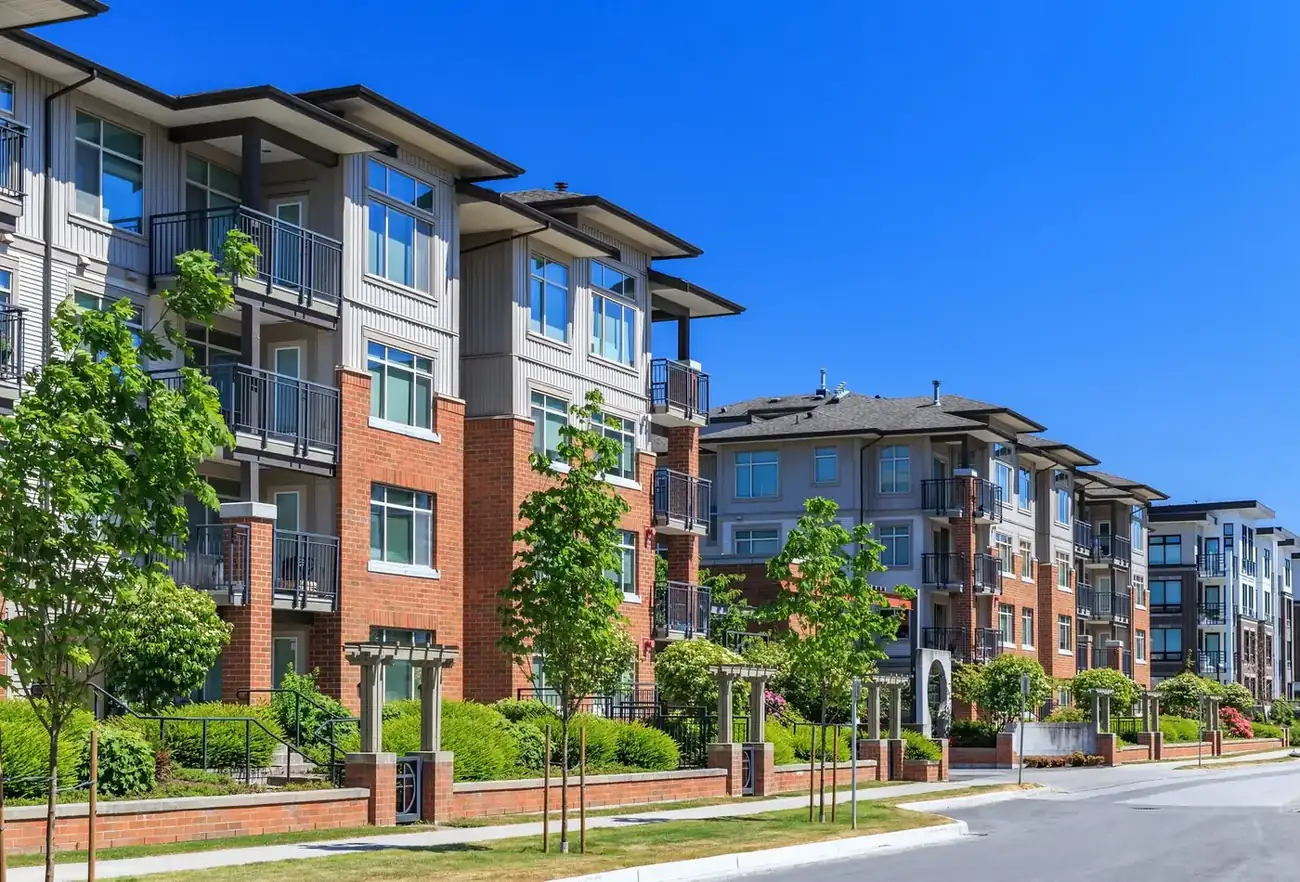 The neighbourhood guidesNine guides, each with its parks, shops, schools, getting around, what we check, and this month’s numbers.
 Moving here with a familySchools by address, the four public secondaries and Southridge, the 351 to Richmond, and what to sort out first.
 White Rock vs South SurreyOne is its own city, the other part of Surrey: taxes, bylaws, housing stock and how prices behave on each side.
The questions people ask us most about the neighbourhoods.
What are the best neighbourhoods in South Surrey?
It depends on what you want. For the beach and a village, Crescent Beach and Ocean Park; for newer streets and walkable shopping, Grandview Heights; for estate grounds, Elgin and Chantrell; for golf-course homes, Morgan Creek; for parks and every amenity close by, Sunnyside Park. Each has its own guide.
Which neighbourhoods have the most houses for sale?
At the end of September 2026, White Rock had 133 houses for sale, 15.3 months of supply at the July to September pace, Crescent Beach and Ocean Park had 93 and the King George Corridor 85. The tables above have all nine.
Where are houses selling fastest?
On houses that sold from July to September 2026, Morgan Creek and Pacific Douglas had the shortest median time to sell, 20 days each, and Morgan Creek sold closest to asking, at 97.1% of list. The figures rest on few sales, so read them as a guide.
Is White Rock part of South Surrey?
No. White Rock is its own city with its own council and bylaws; South Surrey is part of the City of Surrey. They share the peninsula, the beach and many listings marked White Rock / South Surrey.
Which schools serve each neighbourhood?
Surrey Schools sets catchments by address, not by neighbourhood. As a rule of thumb: Elgin Park for Crescent Beach, Ocean Park and Elgin; Semiahmoo for Sunnyside and much of White Rock; Earl Marriott for Pacific Douglas and parts of White Rock; Grandview Heights for the newer streets to the east. The district’s school locator is the ruling for any address.
Sources: Fraser Valley Real Estate Board MLS® data for sub-areas F51 to F59, as published in the October 2026 edition of the White Rock and South Surrey market report (September 2026 data); Surrey Schools school locator. These tables are updated with each monthly report.